
|
Wetlands Survey | June 2008 |

|
Introduction
The South Coast Wetland Monitoring Program is managed by the Water Information section of the Albany office of the Department of Water. Here information is provided on the background and scope of the program, wetland classification terminology, the parameters monitored and the data collection and analysis methodology. The wetland "report cards" are also available in printable PDF format. Background to the Program In 1999 the Water and Rivers Commission and Greenskills Inc. established a program to monitor 30 wetlands in the South Coast Region of Western Australia with funding provided through the Natural Heritage Trust. In late 2005 the Department of Environment (now the Department of Water) obtained National Action Plan for Salinity and Water Quality funding through the South Coast Regional Initiative Planning Team (now South Coast Natural Resource Management Inc.) to continue the monitoring of the original 30 wetlands and to expand the program, ultimately to cover 71 wetlands. This funding ceased on 30th June 2008. The wetlands have been chosen to be representative of the various wetland suites and/or are of high ecological value and/or have had catchment or wetland management works implemented. The wetlands have been monitored twice per year, in autumn and spring, for a range of characteristics to obtain baseline information about the wetland and its suite to enable more informed management of wetlands across the region. 33 of the wetlands are on private land and 38 are on land managed by government agencies such as the departments of Environment and Conservation, Water, Planning and Infrastructure and local government. All land holders and agencies have provided access and support to the staff carrying out the wetland monitoring and several landholders and community members have participated in the monitoring activities and provided assistance, advice and background information. During the period leading up to the end of June 2008, the data from the wetland monitoring program were collated, analysed and reported in the form of short summary report cards. Background and interpretive information was obtained from a variety of sources including the landholders, spatial datasets and management plans written by Greenskills Inc. and the Department of Water. Hydrological information was provided by hydrologists and other officers at the Department of Agriculture and Food and the Department of Environment and Conservation. All collected data are available upon request from the Department of Water, Albany. The wetlands included in the program are shown in the following table. Reports for most wetlands are available (in PDF format) by clicking on the wetland code. |
| Wetland name | Wetland code | Old/new | Easting | Northing | MGA zone | Wetland suite |
| Adam's Swamp | ADA | old | 609526 | 6170889 | 50 | Manypeaks |
| Albany Constructed Wetland | ACW | new | 579792 | 6123451 | 50 | No suite listed |
| Bailey Swamp | BAI | old | 638947 | 6190175 | 50 | Manypeaks |
| Beaumont Nature Reserve | NER | new | 471309 | 6277845 | 51 | No suite listed |
| Benje Benjenup Lake | BEN | new | 398387 | 6270134 | 51 | Benje Benjenup |
| Big Poorarecup Lagoon | POO | old | 521589 | 6191434 | 50 | Unicup |
| Blue Lagoon | BLU | new | 703296 | 6184332 | 50 | Blue Lagoon |
| Blue Lake | BOR | new | 525059 | 6152416 | 50 | Boronia Road |
| Boggy Spring | BGY | new | 705322 | 6188887 | 50 | Boggy Spring |
| Boyatup Swamp | BOY | new | 435559 | 6258521 | 51 | Boyatup |
| Bundarra Swamp | BDR | new | 750153 | 6289047 | 50 | Bundarra |
| Bunker Swamp | BUN | old | 528292 | 6197229 | 50 | Unicup |
| Campbell's Swamp | CAM | old | 686719 | 6197673 | 50 | Pabelup |
| Cascades Swamp | CAD | new | 336573 | 6297872 | 51 | Cascade |
| Condingup Swamp | CON | new | 459053 | 6265394 | 51 | Condingup |
| Coomalbidgup Swamp | COO | old | 349135 | 6268049 | 51 | Coomalbidgup |
| Denmark Ag College Swamp | DMK | old | 534621 | 6131510 | 50 | No suite listed |
| Doombup Lake | DOO | new | 413141 | 6256266 | 51 | Bannitup |
| Dunn's Swamp | DUN | new | 236908 | 6242613 | 51 | Dunn's Swamp |
| Gali Swamp | GAL | old | 628777 | 6173125 | 50 | Manypeaks |
| Gilmour Swamp | GIL | new | 656898 | 6182028 | 50 | No suite listed |
| Guest Road Wetland | GUE | new | 388351 | 6333420 | 51 | No suite listed |
| Gull Rock Lake | GUL | new | 591370 | 6126332 | 50 | Gull Rock |
| Hazeldene Swamp | HAZ | new | 549505 | 6164792 | 50 | No suite listed |
| Hicks Road Swamp | HIC | new | 407640 | 6264746 | 51 | No suite listed |
| Howick Swamp | HOW | new | 477963 | 6264244 | 51 | Howick |
| Jinjinnup Swamp | JIN | old | 686278 | 6192939 | 50 | No suite listed |
| Kalmerndyip Lake | KAM | new | 574608 | 6172617 | 50 | Pallinup |
| Karri Lake | KAR | old | 610787 | 6142068 | 50 | No suite listed |
| Lake Byleveld | BYL | new | 520799 | 6127126 | 50 | No suite listed |
| Lake Chillimup | CHL | new | 598358 | 6176481 | 50 | Manypeaks |
| Lake Eyrie | EYR | old | 558176 | 6151678 | 50 | Lake Barnes |
| Lake Marendiup | MAD | new | 700140 | 6188214 | 50 | Blue Lagoon |
| Lake Matilda | MAT | old | 552365 | 6189931 | 50 | Unicup |
| Lake Monjingup | MON | old | 388784 | 6258702 | 51 | Monjingup Lake |
| Lake Nunijup | NUN | old | 537369 | 6192874 | 50 | Unicup |
| Lake Seppings | SEP | new | 583347 | 6125145 | 50 | Lake Sepping |
| Lake Surprise | SUP | new | 491122 | 6159904 | 50 | Pallinup |
| Lake Williams | WIL | new | 524652 | 6125062 | 50 | Overton |
| Lock Swamp | LOC | old | 652405 | 6166927 | 50 | Cheyne |
| Marshall's Constructed Wetland | MCW | new | 555105 | 6128793 | 50 | No suite listed |
| Melijinup Swamp | MEL | old | 395032 | 6261015 | 51 | No suite listed |
| Mill's Lake | MLL | old | 644512 | 6250104 | 50 | No suite listed |
| Milne Swamp | MIL | old | 620140 | 6222139 | 50 | No suite listed |
| Narrikup Swamp | NRK | new | 557300 | 6157440 | 50 | No suite listed |
| Neds Corner Swamp | NED | new | 319655 | 6266364 | 51 | Neds Corner Lake |
| Oliver Swamp | OLI | new | 585754 | 6205690 | 50 | No suite listed |
| Ongerup Lagoon | ONG | new | 551328 | 6163436 | 50 | No suite listed |
| Pardelup Lagoon | PAR | old | 533899 | 6170881 | 50 | Unicup |
| Peaceful Bay Wetland | PEA | new | 491644 | 6123806 | 50 | Balgamup |
| Powell Lake | ELE | old | 568266 | 6124448 | 50 | No suite listed |
| Pyle Swamp | PYL | old | 610805 | 6155601 | 50 | Manypeaks |
| Qualinup Swamp | QUA | new | 689590 | 6190495 | 50 | Blue Lagoon |
| Rio Swamp | RIO | new | 457213 | 6274121 | 51 | No suite listed |
| Robert's Swamp | ROB | old | 349659 | 6326374 | 51 | No suite listed |
| Russell Swamp | RUS | new | 694643 | 6194500 | 50 | No suite listed |
| Shapland Swamp | SHA | old | 543707 | 6130389 | 50 | No suite listed |
| Smith Swamp | SMI | old | 623965 | 6166060 | 50 | Manypeaks |
| Soothsay Swamp | SOO | new | 307354 | 6265855 | 51 | Soothsay |
| Subasio Swamp | SUB | new | 641602 | 6192126 | 50 | Manypeaks |
| Swan Lagoon | SWN | new | 373718 | 6318000 | 51 | Swan Lagoon |
| Swan Lake | SLK | new | 634795 | 6156816 | 50 | Swan Lake |
| Tarnup Lake | ROC | old | 602864 | 6146286 | 50 | Corimup |
| Telleracks Swamp | PAN | new | 256157 | 6254767 | 51 | Para-Nama |
| Terrell's Lake | TYR | new | 422323 | 6275718 | 51 | Murra Murra |
| Vancouver Lake | GOD | new | 585137 | 6117227 | 50 | Goode Beach |
| Woods Lake | WOO | old | 594290 | 6128560 | 50 | No suite listed |
| Worrongerup Swamp | WOR | old | 531017 | 6196089 | 50 | Unicup |
| Wragg Road Swamp | WRG | new | 549889 | 6160383 | 50 | No suite listed |
| Yellilup Swamp | YEL | old | 682041 | 6193634 | 50 | Pabelup |
| Yendinnup Swamp | YEN | old | 674993 | 6198589 | 50 | Pabelup |
|
|
You can see maps of the sites west of the Fitzgerald and east of the Fitzgerald in a separate window.
Wetland description Wetlands can be described as unique aquatic ecosystems that may be seasonally, intermittently or permanently waterlogged. They vary in the degree of inundation due to differences in landscapes and other characteristics, including local differences in soil types, topography, climate, water chemistry, vegetation and most importantly wetland hydrology. Wetland hydrology relates to water levels and retention time, recharge and discharge and wetland-groundwater connection. Wetlands range from fresh to highly saline and in some areas salinity may be far greater than seawater. They can be highly productive systems and provide habitat and shelter as well as food sources for a variety of aquatic and terrestrial animals including waterbirds, turtles, fish, macroinvertebrates and mammals. Wetland Classification Wetland classification is a means of defining a wetland, and grouping wetlands with similar attributes into wetland suites which can be of use for mapping, reporting and management. There are a number of classification approaches, however in Western Australia, Semeniuk developed a local classification based on landform that includes, for example, highland, flat and basin along with the degree of water permanency including permanent, seasonal or intermittent inundation. The south coast wetlands were evaluated and classified into wetland regions (broad scale classification) and wetland suites (more detailed classification) known as Consanguineous Suites by V.C. Semeniuk Research Group in 1998 and Ecologia Environmental Consultants in 2000. Features used to describe the wetland regions included:
The following table briefly describes wetland types found in south west Western Australia according to Semeniuk (1987).
Parameters Measured The parameters included in the initial NHT-funded wetland sampling program were chosen by the former Water and Rivers Commission and Greenskills Inc. in consultation with the former Department of Conservation and Land Management. For consistency, the initial sampling program was continued with little modification for the expanded NAP-funded program. The water quality parameters include physical measures taken on-site with a water quality sonde and chemical and physical analysis conducted on samples collected from the wetland and preserved and freighted to a NATA accredited laboratory in Perth. The following section describes the purpose and significance of each parameter along with information on the values used to assess the status of the parameter at each wetland. The classification or guideline values used were either generally accepted ranges such as the pH scale or developed by DoW in the case of salinity and colour or guideline values developed by the Australian and New Zealand Environment and Conservation Council (ANZECC) and Agriculture and Resource Management Council of Australia and New Zealand (ARMCANZ). The ANZECC and ARMCANZ values used were those appropriate to aquatic ecosystems including wetlands in the south west of Western Australia. Guideline values were designed to assess the risk of adverse effects to the wetland. Salinity The salinity or salt concentration of a wetland is important because levels of soluble salts which are outside the natural range for a wetland can be toxic to plants and animals and lead to a reduction or change in biodiversity and ecological function. Salinity of inland waters is governed by several factors including the composition of catchment rock or soil and weathering process, rainfall which contributes atmospheric salts, acts as a solvent on rock material and also dilutes inland waters and evaporation which concentrates ions and increases salinity. Removal of deep rooted perennial vegetation and its replacement with shallow rooted annual crops can lead to hydrological imbalance, rising water tables and mobilisation of soil salt stores to wetlands. At each wetland, salinity is measured as specific conductivity (mS/cm) which is a measure of the ability of water to carry an electric current. In inland waters salinity is a combination of four major cations (positively charged) including calcium (Ca++), magnesium (Mg++) sodium (Na+) and potassium (K+) and four major anions (negatively charged) including carbonate (CO3-), bicarbonate (HCO3-), sulphate (SO4-) and chloride (Cl-). The proportion of major ions in each wetland has been monitored. Salinity for this program is classified according to the following scale:
Nitrogen Nitrogen is an important nutrient for plants and animals. Plants take up inorganic, available forms of nitrogen for growth and animals require nitrogen for cell growth. Excessive nitrogen levels can lead to eutrophication, excessive algal growth and ecological imbalance. A number of nitrogen components are measured including total nitrogen (TN) which comprises organic (insoluble) and inorganic (soluble) forms of nitrogen. The concentration of the forms of nitrogen is measured in milligrams per litre (mg/L). In aquatic systems organic forms of nitrogen can be in molecules containing carbon (urea) or in particulate form such as algae or organic debris that are not readily available for uptake by plants and animals. Inorganic forms of nitrogen consist of ammonium-N (NH3-N/NH4-N) and nitrate/nitrite (NOx-N) which are readily available for uptake by plants and algae. Input of nitrogen into wetlands and waterways may be through a number of ways including groundwater discharge, surface and sub-surface runoff, decomposition of dead plants and animals and excretory products and by nitrogen fixing aquatic blue-green algae. Nitrogen enrichment may occur due to discharge from intensive industries and urban areas or via leaching or erosion from agricultural areas. Nitrogen is cycled through a wetland between the water and the sediments in a number of ways including through uptake by plants (including algae) and the animal food chain. Organic matter not consumed by detritivores (animals that mostly eat decaying plant and animal matter) can be broken down by bacteria and fungi. Nutrient enrichment may occur when there is low oxygen at the sediment-water interface caused by the breakdown of organic material by bacteria. Under these conditions nitrogen in the form of ammonium may be released from the sediments into the water body. Loss of nitrogen from a wetland may be via conversion of ammonium to nitrate which may be given off as gaseous nitrogen when there is adequate oxygen. High nitrogen concentrations can be related to the amount of organic material in the water and sediments as well as algae which stores nitrogen. The ANZECC and ARMCANZ guideline values for nitrogen for slightly disturbed south-west Western Australian wetlands are as follows:
Total Nitrogen: 1.5 mg/L Phosphorus Phosphorus is another important nutrient for plants and animals and is vital for all organisms in small quantities. Excessive phosphorus levels can lead to eutrophication, excessive algal growth and ecological imbalance. Phosphorus components measured include total phosphorus (TP) and soluble reactive phosphorus (SRP) which are measured in milligrams per litre (mg/L). Total phosphorus (TP) includes all forms of phosphorus including phosphate bound up with organic matter, particulate phosphorus which is bound to clay and dissolved inorganic phosphorus or soluble reactive phosphorus which is readily available for uptake by plants. Input of phosphorus to wetlands and waterways may be through a number of mechanisms including weathering and erosion of rock, through surface or sub-surface runoff and groundwater discharge. Phosphorus enrichment may occur due to discharge from intensive industries and urban areas or via leaching or erosion from agricultural areas. Phosphorus cycling within wetlands occurs through the uptake by plants and algae and through the animal food chain. Death and decay of animal and plant material may also increase the release of available phosphorus for further plant or algal growth. Much of the phosphorus is bound to clay and silt particles and is generally unavailable but this equilibrium may change with changes in physical conditions including oxygen concentrations and pH. In low oxygen or low pH situations phosphorus bound to sediment particles may be released into the water. The ANZECC and ARMCANZ guideline values for phosphorus for slightly disturbed south-west Western Australian wetlands are as follows:
Total Phosphorus: 0.06 mg/L Colour The colour of the water in a wetland affects the degree of protection to organisms and the degree of light penetration through the water column. The growth of algae in coloured wetlands can be limited due to reduced light penetration, often despite high nutrient content. Water colour of a wetland is expressed in True Colour Units (TCU). True colour is measured by filtering the water sample to remove suspended particles so that the measured colour is due to dissolved compounds. Many wetlands have a natural 'black tea' colour due to the tannins or dissolved organic materials resulting from the breakdown of organic matter such as leaves and woody material. Colour for this program is classified according to the following scale:
Low: < 5 TCU |

|
Chlorophyll a Chlorophyll a concentration is a measure of the amount of the green pigment which absorbs sunlight for photosynthesis in plants or algae in the water. The level of chlorophyll a is an indication of the amount of algae present which provides information on the primary productivity of the wetland and whether nutrient levels or other factors are impacting on the natural ecological balance. Algae are aquatic plants and can be large (macroalgae) seen as floating clumps or 'mats' or microscopic (microalgae) which can appear as discolouration in the water or as a scum on the surface. Often Blue-Green Algae or Cynobacteria form scum and some species may pose a health risk to live stock, birds and people. Excessive growth of algae can be referred to as an algal bloom which occurs when there is an excessive amount of nutrients (especially nitrogen and phosphorus) as well as adequate light and warm conditions. Once an algal bloom has used the available nutrients it collapses, decays and nutrients are recycled. Quite often oxygen is depleted from the system through breakdown of decayed algae by bacteria. The ANZECC and ARMCANZ guideline value for chlorophyll a for slightly disturbed south-west Western Australian wetlands is 0.03 mg/L. Dissolved Oxygen The amount of oxygen dissolved in water is important for the functioning of plants and animals and it influences biochemical reactions in the water and sediments. Oxygen is dissolved in water by diffusion from surrounding air; by aeration (e.g. wind turbulence) and as a product of photosynthesis. Oxygen is consumed by aquatic animals and the processes of decay and breakdown of organic material. Oxygen is poorly soluble in water and the solubility is affected by temperature, atmospheric pressure and salinity. Monitoring oxygen can assist with understanding the water quality of a wetland when interpreted in conjunction with other parameters such as temperature, nutrients and salinity. Thermal and salinity stratification for example can lead to low oxygen in bottom waters. High oxygen concentrations may indicate active algal blooms while low oxygen may indicate a bloom collapse caused by bacteria taking up oxygen when breaking down decaying algae. pH pH is a measure of the concentration of hydrogen ions in the water and indicates the acidity or alkalinity of the water. The acidity or alkalinity affects the bio-geochemical reactions within the wetland water and sediments and the functioning of wetland organisms. Factors such as soil type, geology and vegetation may influence pH. Like oxygen, pH can assist with understanding of wetland water quality when interpreted with other parameters. Changes in pH can affect nutrient fluxes as low pH tends to increase solubility of phosphorus and its release into the water while high pH may cause available phosphorus to bind with calcium to form insoluble calcium phosphate. Low pH may relate to coloured waters where reduced pH is caused by the dissolved organic material. During algal blooms algae may take up carbon or in some cases carbon dioxide as a nutrient source and give off bicarbonate which increases water pH. Disturbance to sediments can also reduce wetland water pH. Exposure of organic sediments containing iron sulfides to oxygen, which oxidise and are then saturated, results in the production of sulphuric acid. The suphuric acid may then mobilise metals into the water column such as aluminium which is toxic to aquatic organisms. Exposure of sediments may be through mechanical disturbance, burning of wetland sediments or extended drying due to low wetland or groundwater levels. The pH scale ranges from 1 (acidic) to 14 (alkaline) with 7 being neutral and the natural range of wetland pH usually being from 6.5 to 8. Macroinvertebrates Macroinvertebrates are the small animals or bugs that live in wetlands, "macro" meaning "able to be seen with the naked eye" and "invertebrate" meaning "animal with no backbone". Macroinvertebrates are a source of food for larger animals such as fish and birds. Each group of macroinvertebrate play a different role in the food chain, some feed on organic material (shredders), others feed on fine organic particles (collectors/filter feeders), others graze on algae (scrapers), some feed on each other (predators), others are parasitic (parasites) and some are macrophyte piercers that feed off living plants and algae fluids. These groups are called 'functional feeding groups' (FFG). Some macroinvertebrates fit into more than one of these groups, for example the water boatman is a predator, a scraper and a macrophyte piercer. The relative abundance of macroinvertebrate functional feeding groups may reflect the ecological status of the wetland. A healthy wetland should have a representative of each functional feeding group. A loss or dominance in a particular group may indicate a change in ecology of the wetland. In the absence of degradation of habitat or water quality, there will always be a natural dominance in relation to natural food sources, for example an abundance of leaf litter will be reflected by an abundance of shredders. Macroinvertebrates require specific habitats, some live on the waters surface, some in the water itself others in the sediment or under submerged logs, rocks and leaf matter. Wetland vegetation plays an important role for macroinvertebrates in providing food, habitat, filtering nutrients, and providing shade which aides in regulating water temperature. The types and numbers of species are highly influenced by the water quality of the wetland. High turbidity or colour in a wetland can reduce light penetration affecting photosynthesis of plants and also reducing temperature. Salinity can greatly change the diversity of macroinvertebrate communities. High nutrient levels can increase algal growth which can reduce or in some cases greatly increase numbers of specific macroinverterbrate species that graze on plant matter. Macroinvertebrates are used to monitor wetland health because many species are sensitive to water quality changes. Midge larvae for example may be an indicator of nutrient enrichment while the presence of dragonflies may indicate a healthy wetland. The types and numbers of species are highly influenced by the water quality of the wetland. Abundance of macroinvertebrate groups and diversity of groups is therefore counted and recorded.
|
|
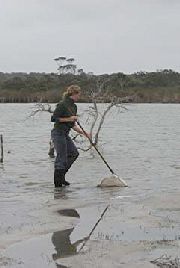
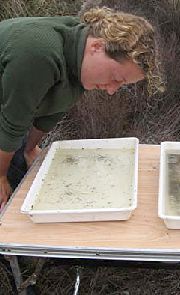
Water Quality and Macroinvertebrate Collection Methods Sampling is carried out by staff from the Department of Water, Albany Regional Office. All wetland sites are sampled twice per year in autumn and the spring. Water samples are collected using a clean well rinsed bucket. For total nutrients (TN/TP) and turbidity, water is then poured into a rinsed sample container and placed on ice or ice bricks ready for lab analysis. For the dissolved nutrients (soluble reactive phosphorus, NOx-N, NH3-N/NH4-N), dissolved ions (Na, Ca, Cl, Mg, K and sulphate) and colour, water is filtered through a 0.45um cellulose nitrate filter paper before filling the sample container. A known volume, usually 1000mL, of site water is filtered through a GFC filter paper to capture chlorophyll a. The paper is then wrapped inside another filter paper and placed in an envelope and on ice or ice bricks ready for lab analysis. Macroinvertebrate information is obtained through two separate sweeps (two by 50 metre sweeps stretching to either side of sample point), using a triangular framed net made of a 250um mesh and with a 400mm wide aperture at the base. For each sweep the sampler wades slowly through the water for a distance of 50 metres sweeping (in a forward and up and down motion through the water column) over a distance of approximately one metre from the bank to the bank's edge (or further depending on water depth). The sampler works the net through the emergent vegetation (e.g. sedges and rushes), among woody debris and in the deeper water to ensure all wetland habitat types are captured. Macroinvertebrates are rinsed into a bucket and through a series of graded sieves into sorting trays for identification. Two trained people then sort through the trays for a pre-determined amount of time identifying the types and approximate quantities of macroinvertebrates present. Macroinvertebrate groups and abundance are recorded on field sheets. Relative variation in water level is measured by surveying the water level relative to an established reference point (star picket) with a local datum. A Sokia automatic level and staff are used to establish the difference in level between the wetland and the reference point. Field observations recorded on each visit include weather conditions, cloud cover, fringing vegetation types and condition, and obvious macroalgae or surface scum as well as weediness and disturbance. At each site, photos are taken from a predetermined location to assist with assessment of temporal changes in wetland and fringing vegetation condition. Storage of data All insitu and laboratory water quality data is stored on the Department of Water WIN database in Perth. Macroinvertebrate, photographic and associated information is stored in spreadsheets and folders on the Department of Water Albany office server. All data and information are available by contacting Tracy Calvert at the Albany office on 9842 5760. |