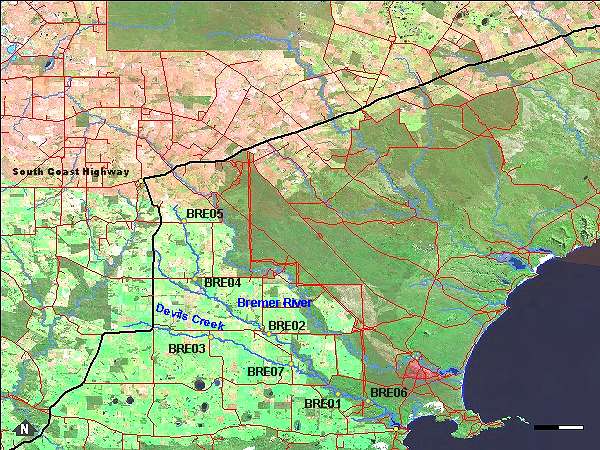
Seven sites were sampled in the Bremer River system. An overview of sampling sites on the Bremer River and Devil's Creek is shown on the map above. There were two sampling runs for the Bremer River catchment, one in 2006 and one in 2007. Photographs are available for each site:
| BRE01 | BRE02 | BRE03 | BRE04 | BRE05 | BRE06 | BRE07 |
The sites lower in the system (BRE01 and BRE06) had vegetation fringing the river that was in the best condition. Sites BRE03, BRE05 and BRE07 that were higher in the catchment and surrounded by cleared land had more degraded foreshore vegetation with weeds and prone to erosion.
The temperature of the water at the sites ranged from 12.33 to 17.1°C.
Salinity was less in the sites lower in the system with the lowest recorded at sites BRE01 and BRE02 in May 2006 at 5.8ppt. Sites BRE03, BRE04 and BRE05 all higher in the system had salinities around 30ppt which is just less salty then seawater. For all sites that were sampled in both May 2006 and September 2007 the salinity recorded in May 2006 was lower. For example site BRE04 on Devils Creek was 34.13ppt (about as salty as seawater) in September 2007 and 13.8ppt in May 2006. For site BRE03 the site was sampled before and after a large rainfall event and the salinity reduced from 23.7ppt to 17.5ppt.
The acidity ranged from pH 7.3 to pH 8.23 so slightly basic at all sites.
Total phosphorus recorded in the water at each site varied significantly from 2006 to 2007 for some sites but in general for September 2007 the concentrations increased up the system with the highest levels recorded at site BRE05 with 390 µg/L. For May 2006 the results were more varied with a higher level in the lowest site. For total nitrogen the same pattern was observed with the highest September 2007 level recorded at site BRE05 with 3000 µg/L and the lowest at site BRE01 with 1200 µg/L. Again in May 2006 the results were more varied with a high level of nitrogen recorded at site BRE01.
