 |
Walpole-Nornalup Inlet water quality | June 1999 |
 The aims of the program are to provide:
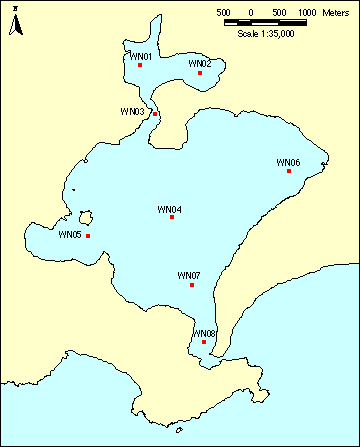
A sampling run is to be completed every three months. On a sampling run data are collected from eight standard sites (WN01 to WN08) as shown. Sites WN01 and WN02 are located in Walpole Inlet, WN03 is in the exchange channel and the remaining sites are in Nornalup Inlet. At sites WN01 to WN07 surface and bottom waters are collected and sent to Australian Environmental Laboratories for the analysis of nutrient levels. The nutrients that are measured are ammonia, oxides of nitrogen (nitrate and nitrite), total nitrogen, filterable reactive phosphorus, total phosphorus, colour, chlorophyll and phaeophytin pigments. A brief description of these terms is provided below. A hydrolab multiprobe is used at each site to collect temperature, salinity, specific conductivity and dissolved oxygen data at approximately 0.5 metre intervals. Secchi disk depths are also collected at each site. Phytoplankton samples are collected from sites WN01, WN02, WN04 and WN07 and sent to the Phytoplankton Ecology Unit of the Water and Rivers Commission for microscope identification.
The oxygen levels recorded within the inlet were all good and around 100% saturation. In January oxygen levels at most sites were above 100% saturation, indicating photosynthesis due to plant life in the water column.
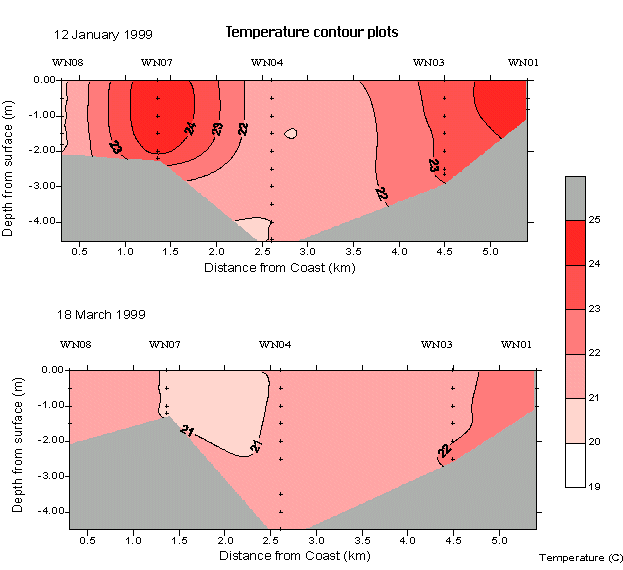
The temperatures reported in Walpole Inlet were around 24.5°C in January and had fallen to 22°C in March. As with salinity, the temperature in Nornalup Inlet in January varied slightly across the Inlet, at the coast water temperatures were 21°C, increased to 24.5°C at WN07 and were 21°C in the centre of the Inlet. In March the temperature throughout Nornalup Inlet was nearly uniform at 21.5°C.
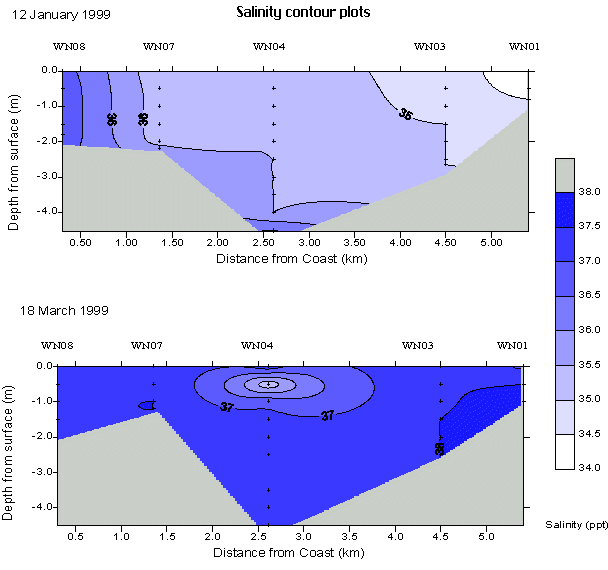
The salinity and temperature data collected for each run are presented in contour plots below. The contour plots are used to represent the distribution of parameters across several sampling sites. The transect for the plots runs in roughly a northerly direction, passing through sites WN08, WN07, WN04, WNO03 and WN01, with the ocean entrance to the left. The points at which a measurement was taken is indicated as a small cross. The bottom profile on the plots is only a guide and is not an accurate indication of the bathymetry of the inlet.


|
Nitrogen (N): Total nitrogen (TN) is a measure of all of the nitrogen in the water column. This includes dissolved, organic and particulate nitrogen. In general only the dissolved forms of nitrogen (mostly ammonium (NH4+) and nitrate (NO3- ions) are available to phytoplankton, other plants and bacteria.
Phosphorus (P): Total phosphorus (TP) is a measure of all of the phosphorus in the water column, including dissolved and particulate phosphorus. Phytoplankton can generally only use soluble phosphate (PO4-) for growth. |
In Nornalup Inlet the levels of total nitrogen and the dissolved forms of nitrate and ammonium were low in both January and March. The levels of ammonium and nitrate were low in Walpole Inlet in January, but were slightly elevated in March. The total nitrogen concentration in Walpole Inlet was similar in both months. The average total nitrogen concentration was 0.29 milligrams/litre in Walpole Inlet, compared to an average of 0.11 milligrams/litre in Nornalup Inlet.
Phosphorus
In general the total phosphorus concentrations were low throughout the inlets on both sampling runs and at all sites. The phosphorus behaviour in both Walpole and Nornalup Inlets was opposite to that of nitrate and ammonium, in that the phosphate levels declined from January to reach very low levels in March. Except for the site closest to the ocean entrance (which reported very low phosphate levels on both sampling runs), the concentrations of phosphate were similar at all sites.
Phytoplankton and chlorophyll
Phytoplankton cell counts are not yet available, however chlorophyll provides a good measure of the amount of algae in the water column. The chlorophyll levels in both inlets in January were low. The levels had risen at each site by March, with the higher chlorophyll levels reported in Walpole Inlet.